Introduction to the problem and scale
- About 70% of the Earth’s surface is water. The volume of available freshwater is only a fraction of that total, at just 1%.2
- A third of the world’s biggest groundwater systems are already in distress,3 meaning water is extracted faster than it can be replenished.
- Water use has been growing at more than twice the rate of population increase. Over the past 100 years4, its usage has been driven by population growth, socio-economic development, and changes to consumption patterns.5
- Climate change could also have significant impacts on the water cycle, threatening rainfed agricultural production which currently supports 80% of global cropland and accounts for 60% of global food production.6
- Globally, water pollution is increasing and harming the ability of ecosystems to sustain themselves and meet human needs.7
- Over two billion people live in countries already experiencing high water stress8 and this number is expected to increase with population growth and increasing urbanisation.
- By 2030, 700 million people worldwide could be displaced by intense water scarcity,9 and the world could face a 40% global water deficit.10
- The challenges of water scarcity, unequal distribution, and contamination are all potential causes for future conflict.
- The total cost of water insecurity to the global economy is estimated at US$500 billion annually. 11
How does factory farming affect water use?
- Agriculture (including irrigation, livestock and aquaculture) is by far the largest water consumer, accounting for 69% of annual water withdrawals globally.12
- Industrial livestock production generally uses and pollutes more surface and groundwater than grazing or mixed systems13 due to industrial systems’ dependence on grain-based feed. Producing 1kg of animal protein requires 100 times more water than producing 1kg of grain protein.14
- The water footprint of any animal product is larger than the water footprint of crop products with equivalent nutritional value.15
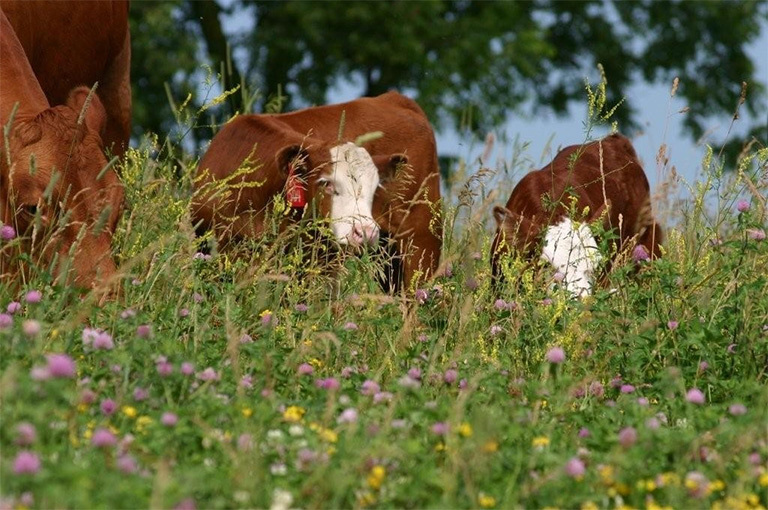
- Less intensive outdoor livestock systems can utilise rainfed pasture, demanding far smaller volumes of water extracted from aquifers.16
- “Intensive livestock production is probably the largest sector-specific source of water pollution” according to a UN World Economic social survey.17 Large quantities of nitrogen fertilisers are used to grow feed, but only 30-60% of this nitrogen is taken up by feed crops; 40-70% is lost to water or the atmosphere.18
- Feed given to industrial livestock has high levels of nitrogen. Pigs and poultry assimilate less than half of the nitrogen in their feed; most is excreted in manure, which is the primary source of nitrogen and phosphorous to surface and groundwater and leads to 'dead zones'.19
Link to the relevant Sustainable Development Goals (SDG)
- SDG 6: Clean water and sanitation: Ensure availability and sustainable management of water and sanitation for all20
- SDG 14: Life below water: Conserve and sustainably use the oceans, sea and marine resources for sustainable development21
- Water Scarcity – One of the greatest challenges of our time. Food and Agricultural Organisation of the United Nations
- National Geographic – Freshwater crisis. Webpage. Accessed 5 November 2020.
- Richey, A.S., Thomas, B.F., Lo, Min-Hui., Reager, J.T. et al. 2015. Quantifying renewable groundwater stress with GRACE
- Water Scarcity United Nations water facts
- UN WORLD WATER DEVELOPMENT REPORT 18 March 2019
- World Water Assessment Programme Facts and Figures. Webpage Accessed 5 November 2020
- National Geographic – Water pollution is a rising global crisis. Webpage. Accessed 5 November 2020.
- United Nations – Water Scarcity Webpage. Accessed 5 November 2020.
- Global Water Institute. 2013
- The United Nations world water development report, 2016: Water and jobs: facts and figures
- The United Nations world water development report, 2016: Water and jobs: facts and figures
- The state of the world’s resources. WWAP (UNESCO World Water Assessment Programme). 2019. The United Nations World Water Development Report 2019: Leaving No One Behind. Paris, UNESCO.p13
- Mekonnen, M. and Hoekstra, A., 2012. A global assessment of the water footprint of farm animal products. Ecosystems.: DOI: 10.1007/s10021-011-9517-8
- Pimentel D, Pimentel M. Food, energy and society. Niwot, CO: Colorado University Press, 1996.
- Mekonnen M and Hoekstra A, 2012. A global assessment of the water footprint of farm animal products. Ecosystems.: DOI: 10.1007/s10021-011-9517-8
- Mekonnen M and Hoekstra A, 2012. A global assessment of the water footprint of farm animal products. Ecosystems.: DOI: 10.1007/s10021-011-9517-8
- UN World Economic and Social Survey 2011. United Nations
- Eds. Sutton M.A., Howard C.M., Erisman J.W., Billen G., Bleeker A., Grennfelt P., van Grinsven H. and Grizzetti B., 2011. The European Nitrogen Assessment. Cambridge University Press
- FAO 2006 report Livestock’s Long Shadow. See page 107 “According to estimates by Van der Hoek (1998) global N efficiency is around 20 percent for pigs and 34 percent for poultry.”
- United Nations Department of Economic Social Affairs Sustainable Development
- United Nations Department of Economic Social Affairs Sustainable Development
